A significant number of pundits focus on the ECRI* Weekly Leading Index (WLI) in their quest to make sense of the stock market’s most likely direction, whereas some advisors and economists are highly critical of the measure.
But what is the ECRI WLI all about? In short, the Index is a composite of seven key weekly economic indicators published in the U.S. ECRI’swebsite offers the following explanation:
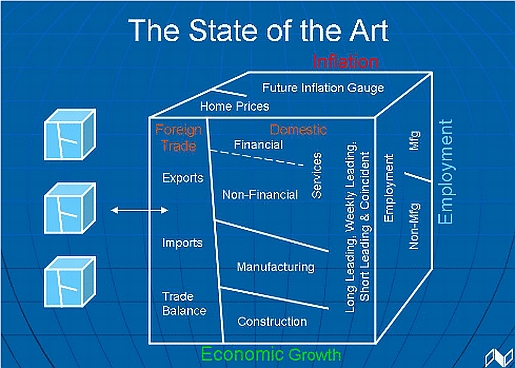
To monitor just the U.S. economy, ECRI uses an array of 19 specialized leading indices in the context of an “economic cycle cube” covering various sectors and aspects of the economy (see chart below).
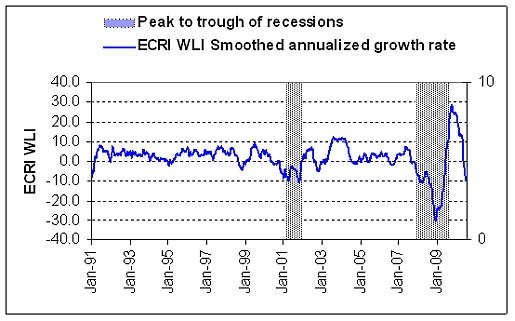
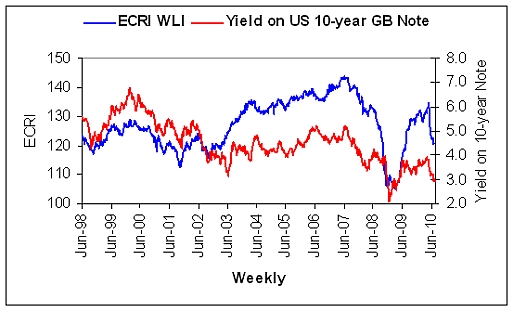
According to ECRI a significant downturn in the WLI forecasts a recession ten months in advance, while a significant upturn precedes the end of a recession by an average of two months. In the past, when the WLI smoothed annualized growth rate fell to -7 and below, it pointed to a contraction in the U.S. economy. With the recent fall to a level of -10.5, commentators are increasingly calling for a double-dip recession in the U.S. From the graph below it seems they have a valid point.
Click to enlarge:
Sources: NBER; ECRI (various internet sources); Plexus Asset Management.
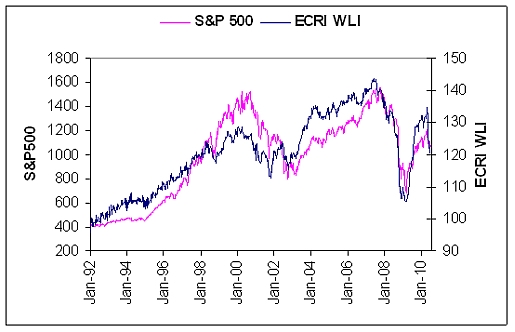
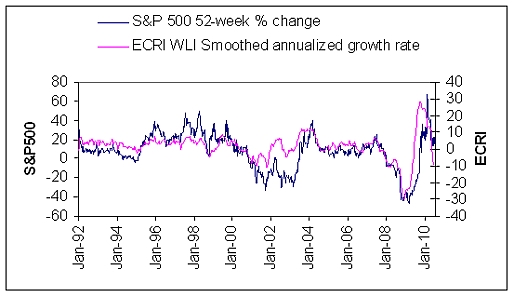
But do they? Let us first consider why the ECRI smoothed annualized growth rate has plummeted. One should bear in mind that many economists and commentators see the calculation of the ECRI WLI as a black box. Obviously the equity and bond markets are probably two of the major leading indicators used in the calculation. Is it a coincidence that the ECRI WLI is so closely correlated with the S&P 500 Index where major turning points coincide?
Click to enlarge:
Sources: I-Net; ECRI (various internet sources); Plexus Asset Management.
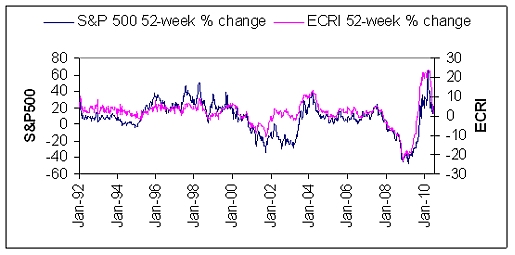
The 52-week percentage change of the WLI is normally a reflection of the 52-week percentage change of the S&P 500 Index.
Click to enlarge:
Sources: I-Net; ECRI (various internet sources); Plexus Asset Management.
It is therefore apparent that the equity market successfully calls recessions. However, there are certain periods, such as in 2002–2003, during which diversions were evident, but they can largely be attributed to other leading indicators such as bond rates.
Click to enlarge:
Sources: I-Net; ECRI (various internet sources); Plexus Asset Management.
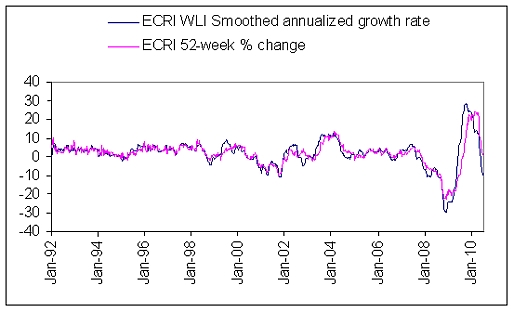
It is also evident that the smoothed annualized growth rate of the ECRI WLI leads the 52-week percentage change of the WLI. This is probably due to the calculation method of the smoothed growth rate where weighted moving averages are applied.
Click to enlarge:
Sources: ECRI (various internet sources); Plexus Asset Management.
Although the smoothed annualized growth rate tends to lead the 52-week percentage change of the ECRI WLI, it can be expected that the smoothed annualized growth rate of the ECRI WLI will also lead the 52-week percentage change of the S&P 500.
Click to enlarge:
Sources: I-Net; ECRI (various internet sources); Plexus Asset Management.
Just beware of the numbers. Over the past 340 weeks 86% of the 52-week percentage change in the ECRI WLI can be explained by the 52-week percentage change in the S&P 500. The massive oversold levels of the S&P 500 Index in February and March last year and the subsequent huge rise then culminated in a significant rise in the WLI. By just focusing on movements in the equity market one may therefore get a wrong signal on recession forecasts.
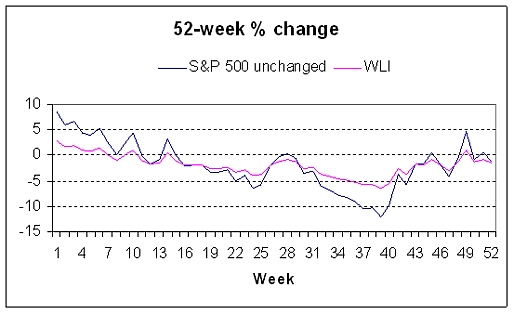
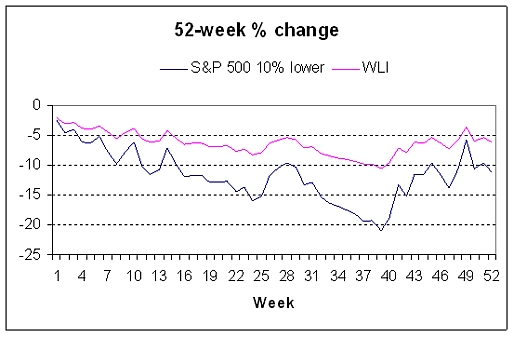
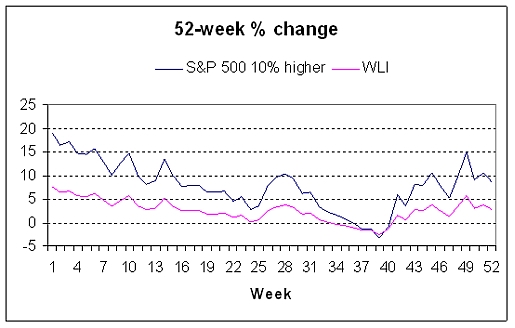
If the same relationship between the 52-week percentage changes of the WLI and S&P 500 persists and we assume that over the next 52 weeks the S&P 500 will be:
unchanged at 1,102
10% lower at 992
10% higher at 1,212
then it is evident that the 52-week percentage change of the WLI will continue to lose momentum for the next 40 weeks in all three cases.
Click charts to enlarge:
Sources: ECRI (various internet sources); Plexus Asset Management.
Sources: ECRI (various internet sources); Plexus Asset Management.
Sources: ECRI (various internet sources); Plexus Asset Management.
With the smoothed annualized rate of the WLI likely to lead the WLI growth rate, the former is likely to gain traction sooner.
It is probably the numbers game that concerns ECRI, as Lakshman Achuthan and Anirvan Banerji stated in their response to recent criticism in a report from Bank of America:
Bottom line, neither the ’experts’ predicting that the sky is falling based on the WLI, nor the other ’experts’ indulging in misinformed WLI-bashing in an effort to discredit the super-bears, have a real clue as to what the WLI is all about. We created the WLI not to be an infallible, stand-alone recession-forecasting machine, but as one small part of a much larger array of leading indices (each made up of many economic indicators) — like the especially prescient U.S. Long Leading Index. This array amounts to a sophisticated sequential signaling system of the economy’s cyclical turning points. The WLI is designed to be interpreted in this broader context, and its message today is quite simple: A slowdown in U.S. economic growth is imminent, but a recession is not.
*ECRI: Economic Cycle Research Institute
댓글 없음:
댓글 쓰기